So you run the analysis on Linux server because the data is huge. Now you want to generate a nice graph or plot to see whats going on.
The script
Using the Iris Dataset I want to generate a plot showing the distribution of the flower examples like this:
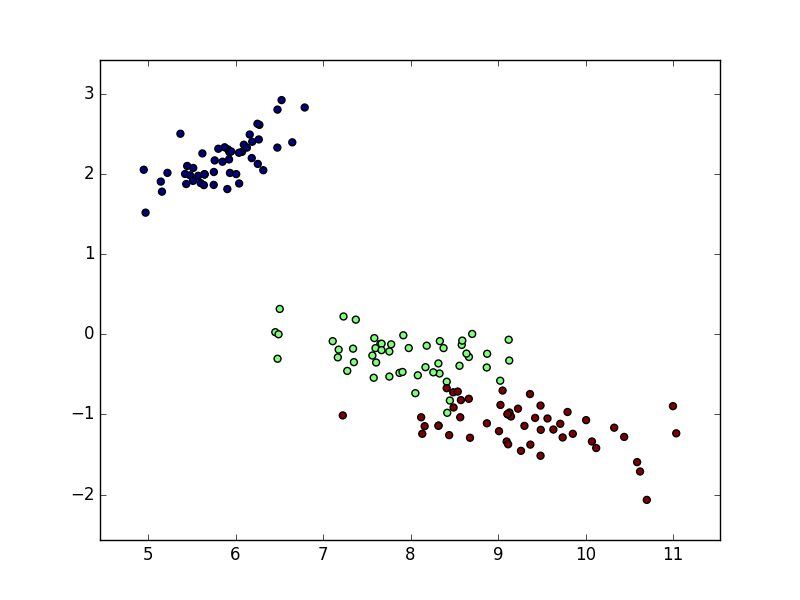
To reduce features from 4 to 2 I use sklearn’s truncated singular value decomposition (which also works on sparse matrices):
import matplotlib.pyplot as plt
from sklearn import datasets
from sklearn.decomposition import TruncatedSVD

iris = datasets.load_iris()
X = iris.data
y = iris.target  # Labels

# Visualize result using SVD
svd = TruncatedSVD(n_components=2)
X_reduced = svd.fit_transform(X)

# Initialize scatter plot with x and y axis values
plt.scatter(X_reduced[:, 0], X_reduced[:, 1], c=y, s=25)
plt.savefig("iris_plot.png")
plt.show()
When running this script on Windows everything seems fine.
Setting up server
On a Linux server with no graphical interface or UI there are no tools for the server to generate a picture. On a clean server I need to install sklearn and its dependencies as well as mathplotlib. To make this easier I use Anaconda:
wget http://repo.continuum.io/archive/Anaconda2-4.0.0-Linux-x86_64.sh
bash Anaconda2-4.0.0-Linux-x86_64.sh -b -p $HOME/anaconda
echo 'export PATH="$HOME/anaconda/bin:$PATH"' >> ~/.bashrc
bash
However, running the script now trows an error:
# ImportError: libSM.so.6: cannot open shared object file: No such file or directory
So I install also these two libs:
# sudo apt-get install -y libsm6 libxrender1
After this running the script trows:
# RuntimeError: Invalid DISPLAY variable
Generate plot
To enable the server to generate the plot I switch to a different ‘backend’. Pyplot enables various backends for different file formats. To generate and save a .png image I use ‘agg’ backend:
plt.switch_backend('agg')
With this I can create my plot and save it. As a side note the .show() method will not be executed when the backend is set to ‘agg’.
The full script code can be seen below or on github: